Home
Muscles

I've been reading Bud Charniga’s translations and it is apparent that the Russian weightlifting coaches and sports scientists were very knowledgeable on all aspects of physiology so I feel it is necessary to be similarly knowledgeable...
Before the advent of the electron microscope nobody really knew how muscles contracted. I have the 20th edition of Gray's Anatomy published in 1918 (I prefer it to the modern atlases) that proposes that muscles swell up with a gel like plasm in a similar manner to the way it was thought that amoeba move.
It is now known that contraction is caused by the action of myosin (purple) filament heads pulling ratchet like on actin (pink) filaments. This is called the Sliding Filament Theory, though everyone accepts it as fact.


The filaments in voluntary muscle line up across the entire muscle fibre producing a striped appearance (visible in a light microscope). In cardiac muscle the lining up is less distinct and in smooth muscle there is no lining up.
Fibre Type
Muscle fibres are generally divided into 2 types, fast and slow twitch. The difference between these 2 types is that they develop the same forces but at different speeds:
| FAST FIBRE | |
SLOW FIBRE |
| |
|
|
| 10 ms cycle = 1 ms pull + 9 ms recovery | |
25 ms cycle = 1 ms pull + 24 ms recovery |
| |
fastest | |
|
|
strongest | |
|
|
fastest | |
|
|
strongest | |
| |
|
|
|
|
|
|
|
|
|
|
|
|
|
|
| dist | force | time | |
dist | force | time | |
dist | force | time | |
dist | force | time |
| nm | h | ms | |
nm | h | ms | |
nm | h | ms | |
nm | h | ms |
| |
|
|
|
|
|
|
|
|
|
|
|
|
|
|
| 15 | 1 | 1 | |
15 | 1 | 1 | |
15 | 1 | 1 | |
15 | 1 | 1 |
| 30 | 1 | 2 | |
30 | 2 | 11 | |
30 | 1 | 2 | |
30 | 2 | 26 |
| 45 | 1 | 3 | |
45 | 3 | 21 | |
45 | 1 | 3 | |
45 | 3 | 51 |
| 60 | 1 | 4 | |
60 | 4 | 31 | |
60 | 1 | 4 | |
60 | 4 | 76 |
| 75 | 1 | 5 | |
75 | 5 | 41 | |
75 | 1 | 5 | |
75 | 5 | 101 |
| 90 | 1 | 6 | |
90 | 6 | 51 | |
90 | 1 | 6 | |
90 | 6 | 126 |
| 105 | 1 | 7 | |
105 | 7 | 61 | |
105 | 1 | 7 | |
105 | 7 | 151 |
| 120 | 1 | 8 | |
120 | 8 | 71 | |
120 | 1 | 8 | |
120 | 8 | 176 |
| 135 | 1 | 9 | |
135 | 9 | 81 | |
135 | 1 | 9 | |
135 | 9 | 201 |
| 150 | 1 | 10 | |
150 | 10 | 91 | |
150 | 1 | 10 | |
150 | 10 | 226 |
| 165 | 2 | 11 | |
165 | 11 | 101 | |
165 | 1 | 11 | |
165 | 11 | 251 |
| 180 | 2 | 12 | |
180 | 12 | 111 | |
180 | 1 | 12 | |
180 | 12 | 276 |
| 195 | 2 | 13 | |
195 | 13 | 121 | |
195 | 1 | 13 | |
195 | 13 | 301 |
| 210 | 2 | 14 | |
210 | 14 | 131 | |
210 | 1 | 14 | |
210 | 14 | 326 |
| 225 | 2 | 15 | |
225 | 15 | 141 | |
225 | 1 | 15 | |
225 | 15 | 351 |
| 240 | 2 | 16 | |
240 | 16 | 151 | |
240 | 1 | 16 | |
240 | 16 | 376 |
| 255 | 2 | 17 | |
255 | 17 | 161 | |
255 | 1 | 17 | |
255 | 17 | 401 |
| 270 | 2 | 18 | |
270 | 18 | 171 | |
270 | 1 | 18 | |
270 | 18 | 426 |
| 285 | 2 | 19 | |
285 | 19 | 181 | |
285 | 1 | 19 | |
285 | 19 | 451 |
| 300 | 2 | 20 | |
300 | 20 | 191 | |
300 | 1 | 20 | |
300 | 20 | 476 |
| 315 | 3 | 21 | |
315 | 21 | 201 | |
315 | 1 | 21 | |
315 | 21 | 501 |
| 330 | 3 | 22 | |
330 | 22 | 211 | |
330 | 1 | 22 | |
330 | 22 | 526 |
| 345 | 3 | 23 | |
345 | 23 | 221 | |
345 | 1 | 23 | |
345 | 23 | 551 |
| 360 | 3 | 24 | |
360 | 24 | 231 | |
360 | 1 | 24 | |
360 | 24 | 576 |
| 375 | 3 | 25 | |
375 | 25 | 241 | |
375 | 1 | 25 | |
375 | 25 | 601 |
| 390 | 3 | 26 | |
390 | 26 | 251 | |
390 | 2 | 26 | |
390 | 26 | 626 |
| 405 | 3 | 27 | |
405 | 27 | 261 | |
405 | 2 | 27 | |
405 | 27 | 651 |
| 420 | 3 | 28 | |
420 | 28 | 271 | |
420 | 2 | 28 | |
420 | 28 | 676 |
| 435 | 3 | 29 | |
435 | 29 | 281 | |
435 | 2 | 29 | |
435 | 29 | 701 |
| 450 | 3 | 30 | |
450 | 30 | 291 | |
450 | 2 | 30 | |
450 | 30 | 726 |
| 465 | 4 | 31 | |
465 | 31 | 301 | |
465 | 2 | 31 | |
465 | 31 | 751 |
| 480 | 4 | 32 | |
480 | 32 | 311 | |
480 | 2 | 32 | |
480 | 32 | 776 |
| 495 | 4 | 33 | |
495 | 33 | 321 | |
495 | 2 | 33 | |
495 | 33 | 801 |
| 510 | 4 | 34 | |
510 | 34 | 331 | |
510 | 2 | 34 | |
510 | 34 | 826 |
| 525 | 4 | 35 | |
525 | 35 | 341 | |
525 | 2 | 35 | |
525 | 35 | 851 |
| 540 | 4 | 36 | |
540 | 36 | 351 | |
540 | 2 | 36 | |
540 | 36 | 876 |
| 555 | 4 | 37 | |
555 | 37 | 361 | |
555 | 2 | 37 | |
555 | 37 | 901 |
| 570 | 4 | 38 | |
570 | 38 | 371 | |
570 | 2 | 38 | |
570 | 38 | 926 |
| 585 | 4 | 39 | |
585 | 39 | 381 | |
585 | 2 | 39 | |
585 | 39 | 951 |
| 600 | 4 | 40 | |
600 | 40 | 391 | |
600 | 2 | 40 | |
600 | 40 | 976 |
| 615 | 5 | 41 | |
615 | 41 | 401 | |
615 | 2 | 41 | |
615 | 41 | 1001 |
| 630 | 5 | 42 | |
630 | 42 | 411 | |
630 | 2 | 42 | |
630 | 42 | 1026 |
| 645 | 5 | 43 | |
645 | 43 | 421 | |
645 | 2 | 43 | |
645 | 43 | 1051 |
| 660 | 5 | 44 | |
660 | 44 | 431 | |
660 | 2 | 44 | |
660 | 44 | 1076 |
| 675 | 5 | 45 | |
675 | 45 | 441 | |
675 | 2 | 45 | |
675 | 45 | 1101 |
| 690 | 5 | 46 | |
690 | 46 | 451 | |
690 | 2 | 46 | |
690 | 46 | 1126 |
| 705 | 5 | 47 | |
705 | 47 | 461 | |
705 | 2 | 47 | |
705 | 47 | 1151 |
| 720 | 5 | 48 | |
720 | 48 | 471 | |
720 | 2 | 48 | |
720 | 48 | 1176 |
| 735 | 5 | 49 | |
735 | 49 | 481 | |
735 | 2 | 49 | |
735 | 49 | 1201 |
| 750 | 5 | 50 | |
750 | 50 | 491 | |
750 | 2 | 50 | |
750 | 50 | 1226 |
The figures in the above table represent a simple model of an myosin and actin filament. The heads on the myosin filament and the attachment sites on the actin filament are each taken to be 15 nm apart and each take up 750 nm lengths on their respective filaments.
Regardless of whether the fibre (or more accurately filament) is slow or fast the contraction time of the myosin head is taken to be 1 ms. However the recovery time of the fast fibre is taken to be 9 ms and the that of the slow fibre to be 24 ms. Thus the fast fibre has a cycle time 2.5 times faster than the slow fibre (and so uses up energy at 2.5 times the rate).
Both fibres are taken to be fresh at the start rather than repeatedly contracting.
The force and time columns are of the most interest. For example a myosin filament can engage only one myosin head (force h = 1) when pulling the actin filament over the first 15 nm, it does this in 1 ms.
However in the fast fibre after 10 ms (150 nm) a second head can operate because the first head has had 9 ms to recover. But with a slow fibre it takes 25 ms (375 nm) before a second head can be engaged. The result overall is that both fast and slow fibres contract at the same maximum speed but the fast fibre generates more force.
Similarly both fibres can generate the same max force at any point in the contraction but it takes longer for the slow fibre to get there.
The result in practical terms is that fast fibres move against particular forces faster than slow fibres.
Note that although it seems like each head of the myosin filament is under individual control that this is not the case. All the head does is respond to whether the actin binding site is close to it and it only does this in the presence of the energy molecule ATP which is utilised when calcium ions are released in response to neural impulses.
Thus a single muscle fibre doesn't respond in an all or none way. The magnitude and frequency of neural impulses determines how much ATP is available to the actin-myosin binding sites and how many fibres are stimulated.
Whenever a muscle fibre contracts a chemical reaction at the binding site (blue) on the actin molecule takes place. A myosin filament is actually composed of numerous myosin 'hockey sticks'. In the presence of calcium ions (Ca++) the binding site is exposed so that head of the stick attaches to it. The head then flexes powered by the energy from ATP.
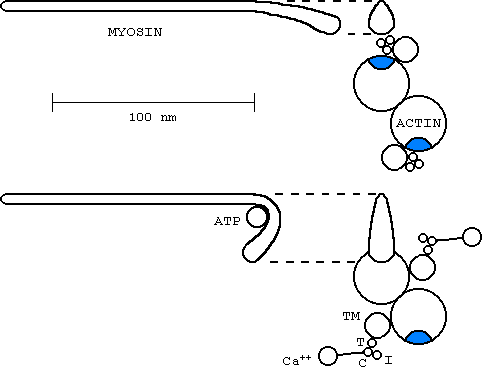
TM - tropomyosin
T - Troponin T, high affinity for TM
C - Troponin C, calcium binder
I - Troponin I, inhibits actin-myosin ATPase
From the table it can be seen that this reaction happens many times per second (40-100 Hz), the result being that flexing of the myosin head pulls the actin filament along somewhat like a man climbing a rope.
Muscle Model
The strength curve of a muscle is derived from an active component (the myosin and actin filaments) and a passive component (the elasticity and shock absorption of the connective tissues).
Muscles are thus modelled on a glut of springs, dampers and contractile components. For simplicity I have considered a single contractile component (the purple myosin and pink actin filament), a single parallel elastic component (the black spring) all enclosed in a fluid filled damper (the red muscle bag).
The spring's resting length depends on the type of muscle, for discussions sake I will define it as occuring when the sarcomere's length is 2.11 µm. Thus when totally relaxed the muscle's length (and therefore joint position) settles at 2.11 µm.
You can see this by letting your arms float in a swimming pool - the elbow joint ends up roughly at right angles, however this is determined by the relaxed tension of a number of flexors and extensors and the position of the shoulder joint. If the triceps were to be cut then the elbow would settle into a more flexed position.


Strength Curve
The strength curve of the sarcomere is determined by plotting the tension curve of the actin-myosin filament and the elastic tension of the associated connective tissues. These forces are added together to get the total tension.
In practice the total strength curve of a muscle is measured by simply stretching it and measuring the force it produces as it elongates. The same method is then used but whilst the muscle is activated. Thus the total tension minus the elastic tension gives the active tension of the whole muscle. With sensitive instruments this can be done for a single muscle fibre. The actual length-tension curve of a whole muscle is smooth thus justifying the name curve.
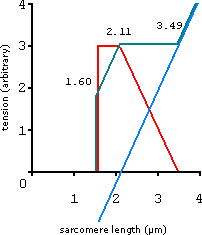
active tension (red line) + elastic tension (blue line) = total tension (green line)
It should be noted that the sarcomere model is artificial in that it assumes that the spring tension is like that of a metal spring.
The above model shows the length-tension curve of an isometrically contracting sarcomere. Thus the sarcomere is set at a certain length and the tension at that length is measured - it is assumed at each length that the actively contracting sarcomere is fully refreshed.
Cheating and the Strength Curve
The term 'cheat' implies that one is trying to get something for nothing.... however in this article it is treated as a strictly biomechanical term.
Earlier I described how the mechanics of the individual sarcomeres give a smooth muscle curve such as:
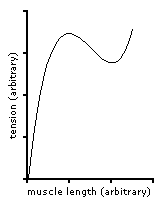
This curve would be derived from a series of isometric measurements, thus minimising errors due to fatigue and friction.... for example fatigue even during a single concentric rep would distort the curve so that it would look weaker at shorter lengths. One would also have to take into account that a muscle measured in vivo would be different to that in vitro.
A barbell provides up and down resistance. The magnitude of this resistance can be calculated from Newton's formula;
F = m(g+a) (see Force)
F - force (Newtons (N) (kg.m.s-2))
m - mass (kg)
g - gravitational acceleration (10 m.s-2)
a - acceleration (m.s-2)
Thus the 'weight' of a barbell is determined by gravitation and the acceleration applied to it.
Thus the weight of a barbell can be altered by varying the acceleration applied to it, where;
a = F/m - g
Example
Imagine a Preacher Curl where the biceps muscle produces a constant force of 6000 N. The barbell moves at a constant vertical velocity....
Constant Force
60°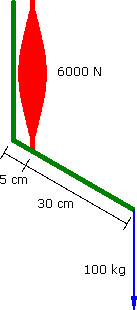
a = 0 m.s-2 |
90°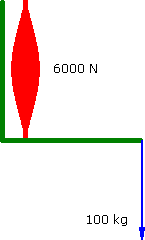
a = 0 m.s-2 |
120°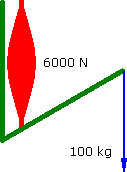
a = 0 m.s-2 |
However a muscle does not have a flat strength curve. Assume for simplicity that it ramps up in linear fashion as it contracts....
Increasing Force
60°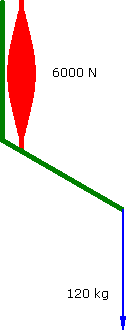
a = -1.667 m.s-2 |
90°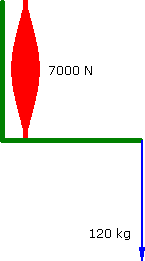
a = -0.278 m.s-2 |
120°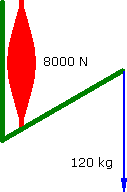
a = 1.111 m.s-2 |
Alternately assume that the muscle's force decreases as it contracts....
Decreasing Force
60°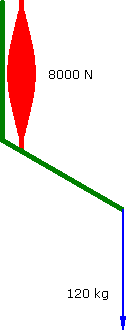
a = 1.111 m.s-2 |
90°
a = -0.278 m.s-2 |
120°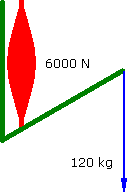
a = -1.667 m.s-2 |
Compensatory Deceleration
Fred Hatfield often talks about compensatory acceleration. For example one would lower into a Squat and on ascending they would apply maximum force to get past the sticking point, once past the sticking point the weight would feel lighter but one would compensate by accelerating to make it feel heavier.
However I prefer (where possible) to apply compensatory deceleration. This has 2 benefits;
-
More weight can be lowered.
-
If the correct weight is chosen the point of zero acceleration can be made to coincide with the point of minimum (sometimes zero) velocity and thus a maximal weight can be handled at the muscle's strongest point of contraction.
Thus cheating allows one to vary the force applied to a muscle both on the positive and negative strokes of a lift. Also by making the weight travel slowest at its strongest point it also generates the greatest stimulus.
The problem with compensatory acceleration is that the weight moves fastest at the point where the muscle is strongest. A muscle which is contracting quicker trades off some of the force that it can generate (the force-velocity curve). One is also somewhat fatigued by the time one gets to this point (having had to struggle slowly through the sticking point) so the actual amount of force generated is not nearly as great as if one were to do say a partial from this point. This is why one can lockout a huge weight but have trouble locking out a full move. In a sense cheating is a way of getting the best bits of full and partial moves and putting them into one lift.
6th October 2023